Self-Healing Code: A Journey through Auto-Remediation
This is a story about what we’ve learned in building an auto-remediation system for one of our Digital Marketing solutions.

Managing modern product infrastructure and applications is daunting because the bigger the infrastructure, more complicated the operational challenges you face. Things break, daemons die, services stop, clusters fall — not to mention writing the root cause analysis (RCA) documents and runbooks on how to fix the same problem in the future. If you keep on adding monitoring, you end up having a huge pile of alerts and failures every day.
To ensure availability of product as you scale, either you automate or you die. This is where auto-remediation comes into picture.
Auto-Remediation, or self-healing, is a workflow which triggers and responds to alerts or events by executing actions that can prevent or fix the problem.
The simplest example of auto-remediation is restarting a service (let’s say apache) when it’s down. Imagine an automated action that is triggered by a monitoring system to restart the service and prevent the application outage. In addition, it creates a task and sends a notification so that the engineer can find the root cause during business hours, and there is no need to do it in the middle of the night. Furthermore, the event-driven automation can be used for assisted troubleshooting, so when you get an alert it includes related logs, monitoring metrics/graphs, and so on.
The Start of our Journey
We’re a team in Adobe Digital Marketing TechOps. This is a story about what we’ve learned in building an auto-remediation system for one of our Digital Marketing solutions.
Motivated by the constant stream of alerts and common issues we saw, we worked toward building a system to automatically remediate some of these alerts. We wanted to leverage systems and tools we were already using, like Nagios, Salt Stack, incident management system, and various scripts people had written to handle these issues. We were able to build a system based on Salt’s event bus using Reactors and Orchestrators. We have seen good benefits from it in the last year. We’ve also learned quite a bit in the process and are currently working on more improvements for the system.
Prerequisites
You need to have some knowledge of the following to understand this article better:
- Basic knowledge of Python
- Basic Knowledge of Salt Stack (Python based open source configuration management tool)
- Knowledge of Nagios
- Basic Bash or Python scripting knowledge
The Details of our Journey
We used to get lots and lots of alerts. We had these alerts and corresponding actions documented in runbooks. We kept adding the new alerts and ways to handle them to the runbooks and shared the knowledge among the team members. We realized that some of the actions didn’t require human intelligence to handle them. We found them to be the right candidates for automation.
To achieve this automation towards auto-remediation, we started designing a generic framework. This involved reviewing what we were already doing and figuring out what we could leverage from existing tools and practices. For example, Nagios was already running checks to detect failure, we could utilize that.
Breaking the design in parts, following key components came out:
- Detect failure
- Notify “the system” of failure event (including hostname and service that is alerting)
- “The System” listens for failure events and triggers auto-remediation response (response may need to run commands on a remote box; so, it would need remote access)
- Logging of all actions and attempts to remediate; to monitor and improve “the system”
We were already using Salt for config management and remote execution, so we could leverage it for running things remotely.
Without knowing what the rest of “the system” would look like yet, we started with a simple python script to restart a service- just one to start with. We made the script idempotent- used the same Nagios check to detect if the service was down and needed a restart. We made this script easy to use- placed it in /usr/local/bin/ so that it could be run as root or as a non-privileged user via sudo. We wanted to be flexible so that it would be easy to integrate and use later.
We created a salt state that deployed the python script to all appropriate hosts, and another salt state to invoke the script. Thus, we could have salt run the remediation python script. It seemed that Salt could fit the requirements for our “system”, but we needed the rest of the components.
Next, we needed a way to notify Salt of alerts and have it run that state to remediate the alert. Salt uses a message bus internally for communication of events between minions and the master. Salt also provides methods for sending custom events on the same message bus and Salt Reactors which respond to specified events.
Salt events have two parts- a tag and a body. The tag is a string that helps identify the type of message- it can be unique but doesn’t have to be. The body is JSON and can contain any number of custom fields. You can watch the events on the message bus from the salt master with a command:
salt-run state.eventWe came up with a custom tag that we could identify and look for, and placed some values in the body related to the alert like the output from the Nagios check.
Sending the event was simple enough with the command:
salt-call event.send “company/product/check_product/$service/$1” message=”$OUT” > /dev/null 2>&1But we ran into a problem running that command as the nagios user. This command needs to be run as root or via sudo. We decided to run the check not as the nagios user, and instead have the salt minion run it. We used the salt minion’s scheduler to execute the check every 5 min and when it needed to send events there were no problems- because the minion ran as root.
We then set up a Salt Reactor to listen for our custom events. Reactors match events by their tag, and it allows for wild-cards. So, we could set a Reactor to match tags like company/product/check_product/anyservice/*
Reactors have some known limitations around scalability when they are doing many things in parallel — like executing several states or steps in a remediation. It is highly recommended, and we observed it too, that the Reactor should only do one thing at a time. But we wanted the flexibility to do any number of steps to remediate a given problem. So we looked at Salt Orchestrators — which are designed to run from the salt master and allow for complex workflows using different states and even different minions. We set our Reactor to launch an Orchestrator which handled the auto-remediation (by invoking the salt state to execute the remediation script).
Final Architecture
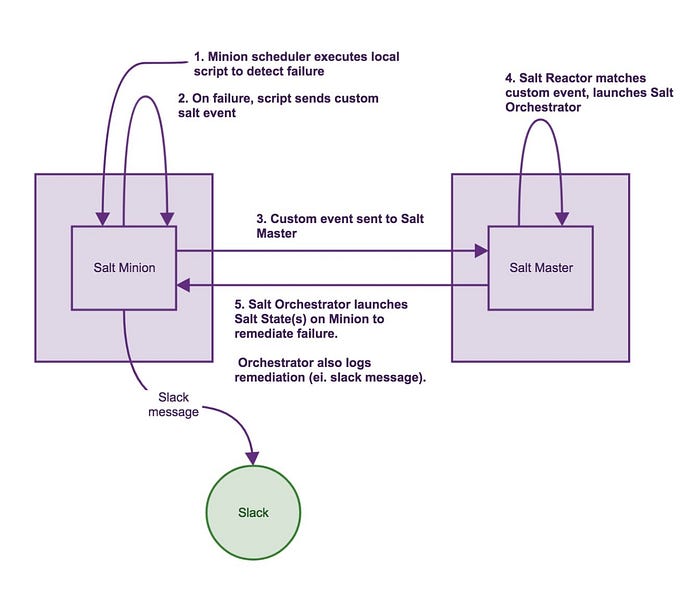
Detecting failures
We use the scheduler in salt minions to execute a script on a regular interval. The schedule is specified in pillar data. Script contains functions to check different parts of infrastructure e.g. mongo, nginx, redis, haproxy etc. One such example is as follows:
function mongo {
  FAIL=0
  if [ -f /raid/pids/mongo.$1.pid ] && [ -d /proc/`cat /raid/pids/mongo.$1.pid`/ ]; then
    OUTPUT=`echo "db.serverStatus()" | /usr/bin/mongo $IP:$1 > /dev/null 2>&1`
    checkexit $? "mongo $1"
  else
    fail "mongo $1"
  fi
  pass "mongo $1"
}
Sending notification of failures as Salt events
When the script finds warnings or failures, it sends the event to salt using
salt-call event.sendThe script to detect is the same used by Nagios, but we run it by Salt so that we can execute above command when there are alerts, otherwise the logic is identical for detecting failures. Running this script via the salt-minion has the advantage of executing the script as with the same privilege as the salt minion (root), so we don’t need to use sudo to send the event (if run as a non- privileged user like nagios).
Custom salt event sent to Salt master
Salt events travel to Salt master
Salt Reactors on Salt master configured to match these alert events, triggering an appropriate Salt Orchestration state
Reactors are configured in /etc/salt/master config file and point to reactor files in /srv/salt/reactor/. The reactor files should be simple and only execute one thing, and thus we have it launch an orchestration state which can have as many pieces and components as we need, specifying order and dependencies
Salt Orchestration states launch remediation states and logging
The orchestration files for remediation are located in /srv/salt/global/orch/ and should contain calls to log/notify when the remediation has been triggered and some details about the alert. The orchestration file sends notifications to the Slack channel. Other states may be incorporated as needed.
Stopping auto-remediation as needed per host
There are cases where an SRE will need to work on a host (debugging issues, upgrades, etc) and will need to disable the auto-remediation while this work is going on- otherwise the auto- remediation may attempt to restart services in the middle of maintenance going on. To disable, enable, and check the status of auto-remediation another script has been deployed to all hosts
in /usr/local/bin/self-healing-alerts <start|stop|status>.
When told to stop, this script writes to a lock file /tmp/.disable-self-healing-alerts.lock when with a timestamp and the user who stopped it. When checking status it checks for this lock file and concatenates it to stdout if it exists. To start self-healing-alerts, the lock file is removed.
The script to detect failures and send custom salt events, has been modified to also check this same lock file and not sending alerts if the lock file exists.
Achievement
Our Journey Continues
Future improvements include:
- Add better logging and tracking of failure events, reactors matching these events, reactors launching orchestration states, remediation states started, success or failure of remediation state (did exit ok?), success of over-all remediation (did the alert state recover?). Perhaps graph all these metrics in Grafana.
- Handle multiple alerts repeating (duplicates of same alert) while remediation is working in process- don’t respond blindly to every alert, allow alerts to keep coming but only respond once until remediation has either succeeded or failed and needs to try again.
- Log other data with event- ps list, free -m, df -h, etc. of host. Get a view of what may be happening with host/service at time of alert.
- Use RabbitMQ or Kafka for better resilience of event messages, so messages don’t get lost. Kafka may allow for other processes to watch the queue and do something with the alerts.
Glossary
- Nagios: https://www.nagios.com/ — A popular monitoring tool for system parameters
- Saltstack: https://saltstack.com/ — A configuration management tool gaining popularity at rapid pace
- Salt Reactors: https://docs.saltstack.com/en/latest/topics/reactor/
- Salt Orchestration: https://docs.saltstack.com/en/latest/topics/orchestrate/index.html
Note: Paths mentioned in the documents are only indicative. You can have your own path structure to keep the scripts.

